

SAMT HOME STUDY COURSE
Introduction
We are pleased to announce the availability of the SAMT Home Study Course. This course is based on the syllabus of the International Federation of Technical Analysts (IFTA) for the Certified Financial Technician (CFTe) qualification. Please see the IFTA website for more information at this link.
The CFTe examination is a two part examination, with part one being multiple choice and part two being a written paper. Details of these examinations, including mock questions, can be seen here.
The SAMT has partnered with the UK Society of Technical Analysts who developed this world-class e-learning tool which is the best product on the technical analysis market. It has been developed by a number of authors, each expert in their field, including:

What content do you get?
The material comprises fifteen units and are presented using text and graphical information. In total, the 15 teaching units contain over 350 images, and close to 100,000 words – all presented in ‘digestible’ sections. Each teaching unit is introduced by a video resumé, and each contains an animated focus chart. Each unit provides access to a store of multiple choice questions and answers in ‘Exambuilder’ to self-test progress, and to test understanding of each topic before sitting the CFTe examinations. Check out our image gallery to get a preview:
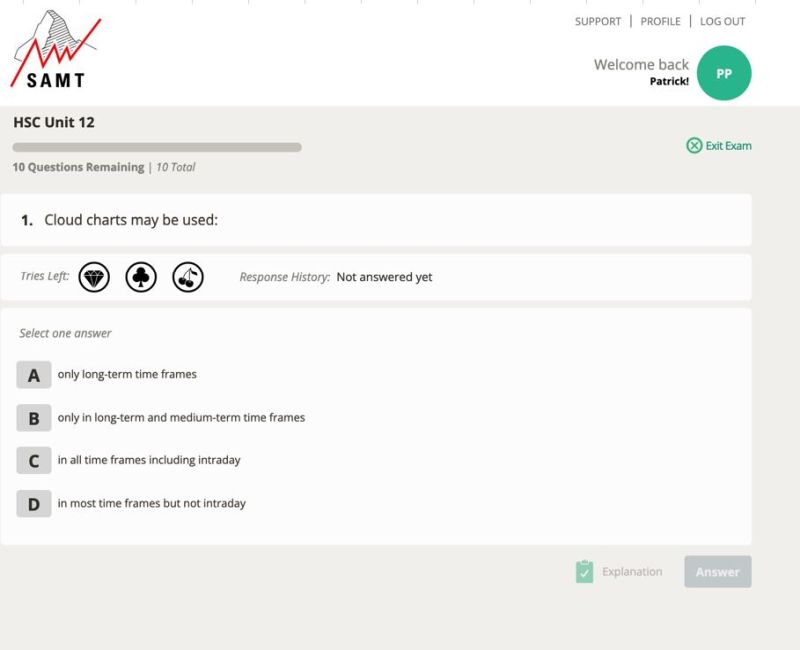
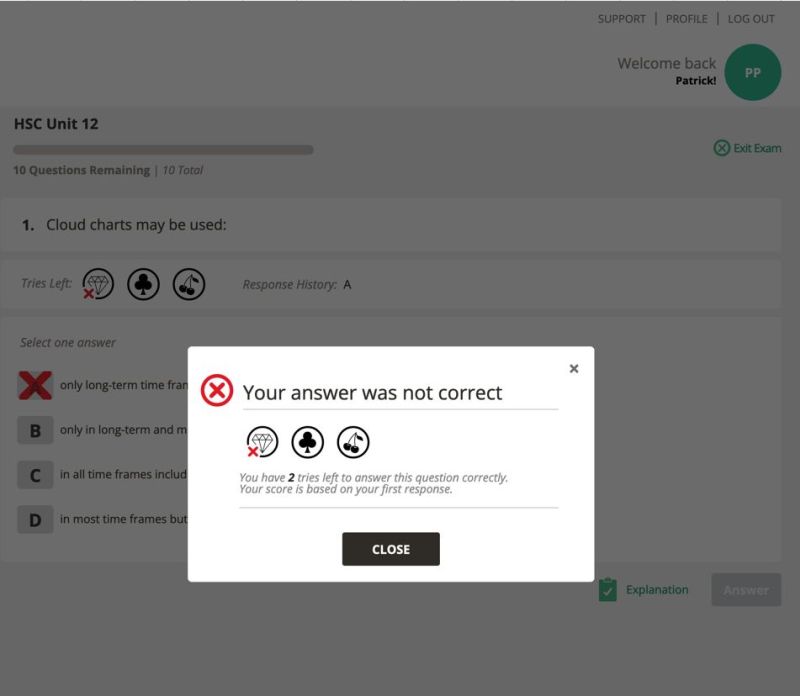
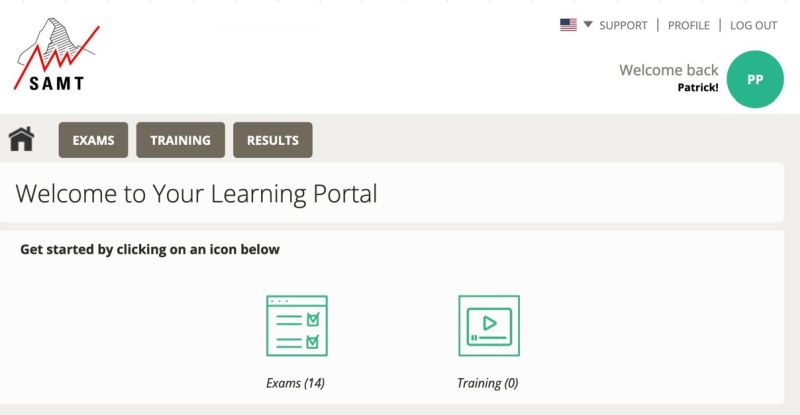
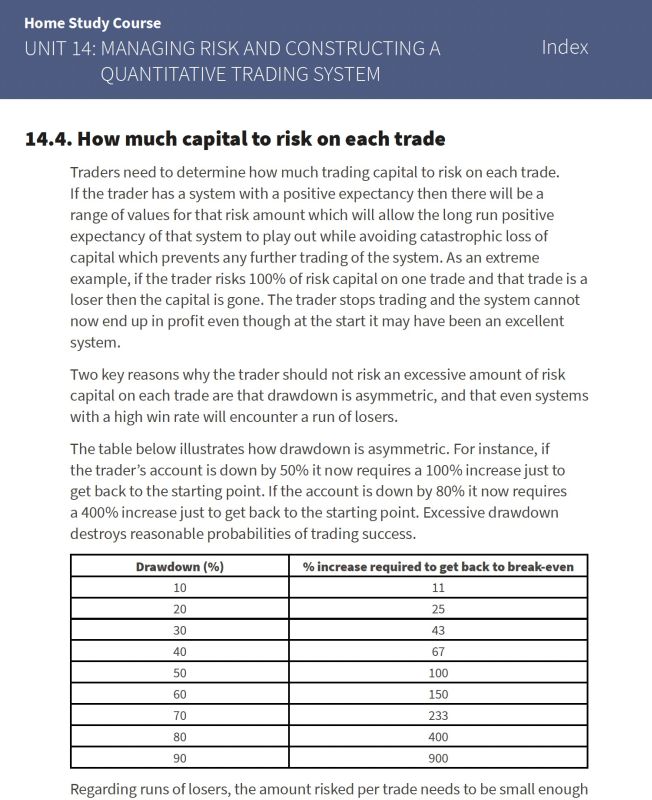
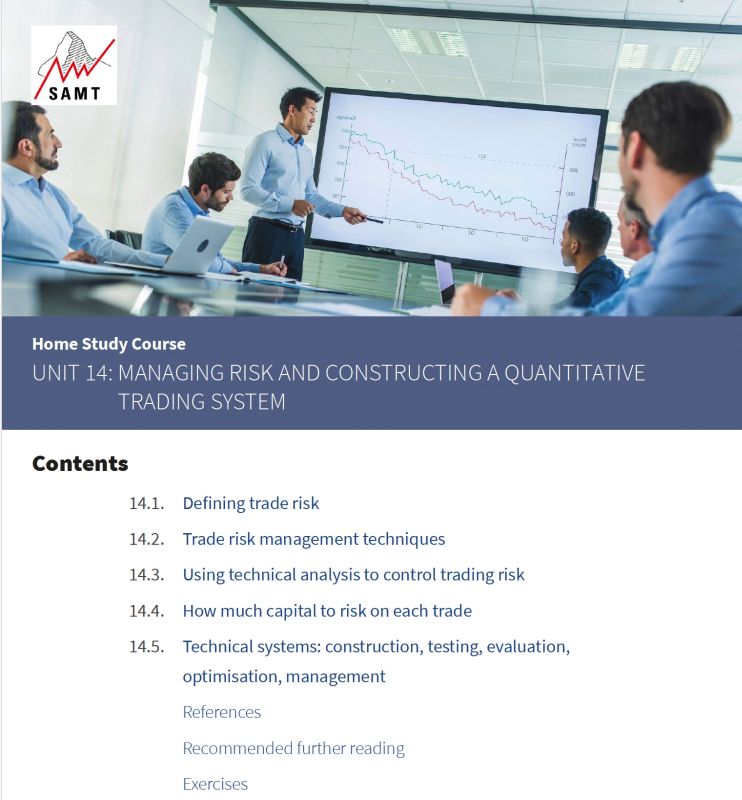
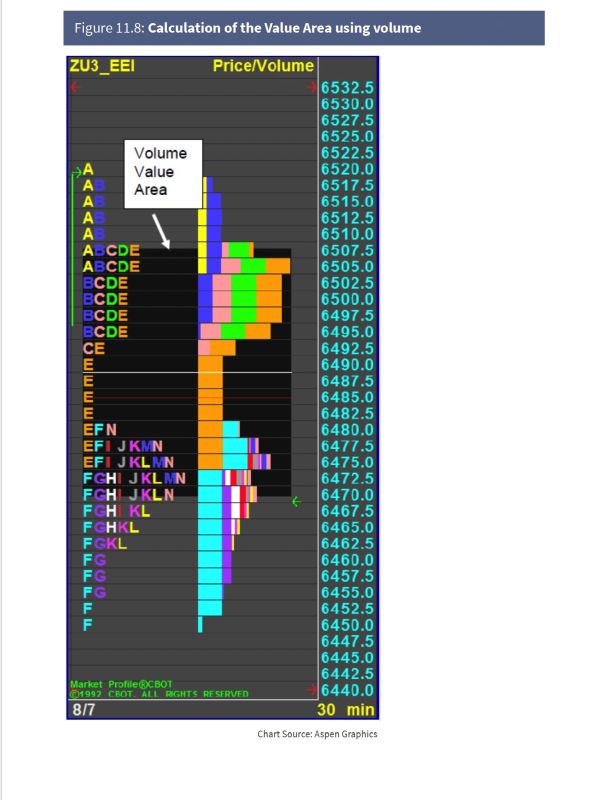
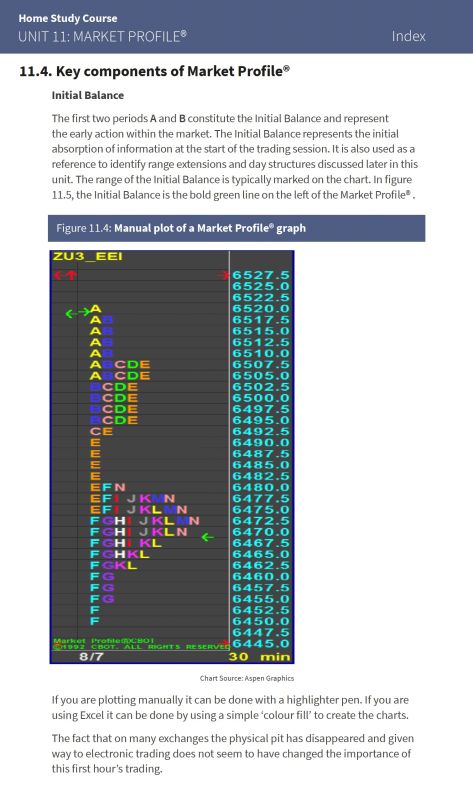
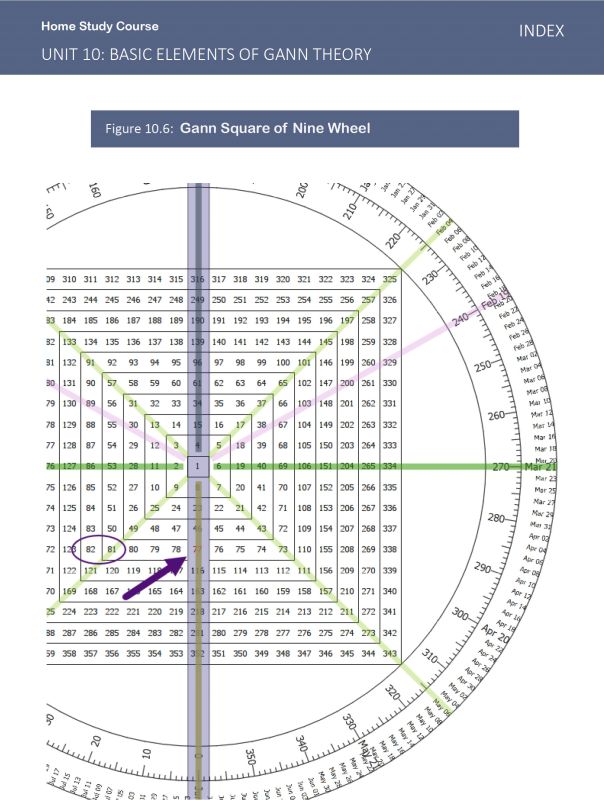
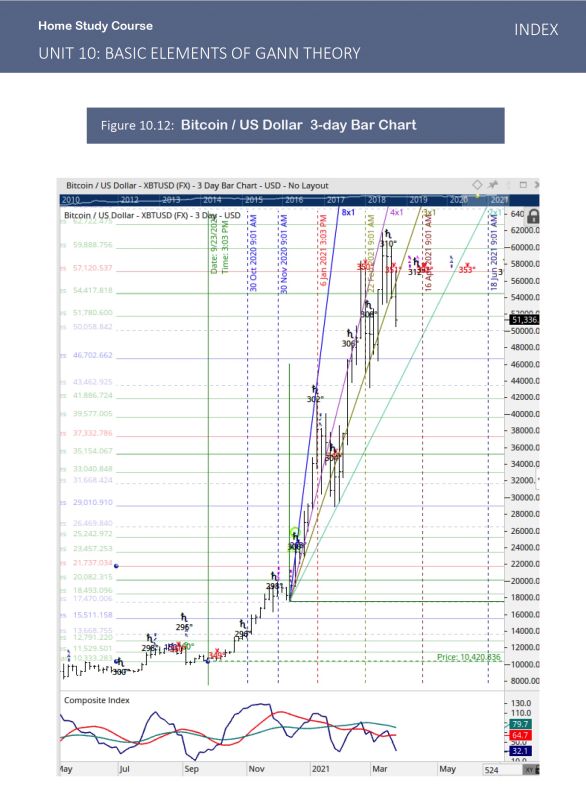
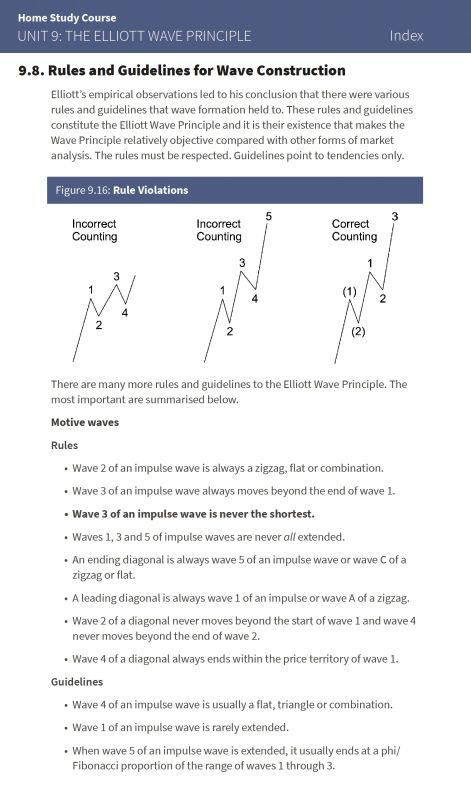
The course material is text based with graphics, some of which are dynamic. There are over 500 pages in the course.
Although website based, it is fully downloadable and may be used online or offline by PC, Mac, iPad or Android machines.
Content covered (syllabus)
The HSC comprises the following units:
1. Foundation – Michael Smyrk; Luise Kliem
Fundamental, quantitative and technical analysis compared; support and resistance; chart patterns and trend lines; Fibonacci targets; time frames.
2. Chart Types – Michael Smyrk; Luise Kliem
Construction of the five main chart types; detailed coverage of line charts (including relative strength) and bar charts; price and volume; equivolume charts; scaling.
3. Point and Figure Charts – Jeremy du Plessis
In-depth tuition in the construction and application of point and figure charts; point and figure-based relative strength, market breadth and moving averages.
4. Candle Charts – Adam Sorab; Luise Kliem (other Japanese charting techniques)
In-depth tuition in candlestick construction and interpretation; over 80 candle lines/patterns illustrated and explained; section on Heikin-Ashi, 3-line Break, Renko, and Kagi charts.
5. Dow Theory and Market Breadth – Michael Smyrk
Development and principles of Dow Theory; use of market breadth measures, including various advance-decline measures, stocks vs their moving averages and net new highs.
6. Moving Averages – George MacLean
Construction and application of different moving average types; envelopes; Bollinger Bands; the Coppock curve.
7. Momentum Indicators and Oscillators – Elizabeth Miller
Construction and application of momentum indicators and oscillators including ROC, RSI, Stochastics, MACD, Parabolic SAR, ATR, Directional Movement, CCI.
8. Cycles – John Cameron
Background history to time cycles; construction and application of cycles in financial markets.
9. The Elliott Wave Principle – Murray Gunn
Philosophical foundations; the fractal structure; psychology; nomenclature; motive and corrective waves; channeling; phi; the alternative waves issue.
10. Basic Elements of Gann Theory – Constance Brown
Gann’s swing chart; retracements; ‘magic’ squares; fan lines.
11. Market Profile® – Daniel Gramza
Background methodology; plotting Market Profile®; key components; the market’s auction process; day structures; early evaluation of the day’s trading action; alternative formats.
12. Ichimoku Charts – David Linton
Cloud chart construction and interpretation; multiple time frame analysis.
13. Market Psychology, the Trading Plan and Money Management – Julian McCree
Market psychology and investor sentiment; trading plans and money management; money management formulae.
14. Managing Risk and constructing a quantitative Trading System – Malcolm Pryor
More on money management including using technical analysis to control trading risk; the construction, testing, evaluation, optimization and management of technical systems.
15. Behavioural Finance – Steven Goldstein
Case study: the 2007 financial crisis; EMH; behavioral economics and behavioral finance; behavioral biases and non-conscious behaviors; prospect theory.
Exam Prep – Luise Kliem
Guidance on the Part 1 exam; advice on Part 2: what examiners look for, timing plan, annotating charts, different ways to structure the answer to Question 1, an example of chart annotation and report writing.
Report Writing – Anne Whitby
Advice on writing professional technical analysis reports and commentaries.
Price
This course is available to everybody, but SAMT Members enjoy a special discount (-100CHF). If you are not a SAMT Member and would like to join, please click here. The cost of the course is CHF 1599, payable upon registration for the course.
SAMT BLOG
Education is a permanent process – never stop reading. We recommend you to check out our BLOG, where you will find articles related to technical analysis on a regular basis to keep you at the pulse of the market.
“If you are not willing to learn, no one can help you. If you are determined to learn, no one can stop you.”
—Zig Ziglar
Frequently Asked Questions
We recommend that a student allows 2-3 months to prepare for the examinations, spending 10-15 hours per Home Study Course (HSC) unit (depending on the size of the unit concerned and prior knowledge of technical analysis). Students may need to allow more time to read some of the books from the recommended reading list on the IFTA (www.ifta.org) or STA websites (https://www.sta-uk.org/education/reading-list/). However, you are welcome to take as long as you like with the HSC, there is no time pressure.
Unfortunately, due to copyright restrictions, we are unable to allow students to print out the HSC.
Today given the wide range of free chart services available on the web, to complete the course, it’s not necessary to purchase a chart service or software package. A selection of Free EOD chart services may be obtained using Google.
The following providers were used to produce the charts in the course: Alpha Terminal, Aspen Graphics, MetaStock Pro, ShareScope, StockCharts.com, Thomson Reuters, Trade Navigator, TraderMade and Updata.
If your test quizzes no longer appear it is likely to be because you have successfully completed the quiz or have had more than 9 unsuccessful attempts at it. If you wish to have this count reset, please contact us.
This will be because the encryption software needs to check with the central server that your license is still valid. Please re-attempt opening the course when you are connected to the internet to resolve.
No problem. Just contact contact the office and you will be issued with a new license.
The course is available in English only.
Due to the vast material available, the course is a good preparation for the CFTe level 1 and level 2 exam.
Still have questions?
Send us an Email or fill out the form below with any questions you may have.
What’s next?
1) register and pay for the course
2) as soon as we receive the payment, we will contact the administration of the STA (please allow us 24h for that)
3) meanwhile, download the Safeguard Secure PDF viewer and access the member area to download the encrypted Home Study Course file.
4) The STA validates the license and sends an email with license activation information directly to you
5) having a valid license, you can activate the Locklizard programand start reading and completing your studies
