
Gold: Insights from Historical Trends and Technical Analysis
Market Movements and Recent Volatility
At the close of January, precious metals experienced notable bearish movements, with silver suffering a daily loss exceeding 27% and gold declining by 9.83%. These sharp downturns signal a particularly critical phase for the market. Historically, gold has been regarded as a dependable asset for hedging portfolios during times of uncertainty. Recently, however, precious metals have seen rapid price increases, driven in part by speculative buying through exchange-traded funds (ETFs). The appointment of Kevin Warsh as a potential chairman of the Federal Reserve has led to a gradual withdrawal by some market participants, further influencing price dynamics.
Historical and Technical Context
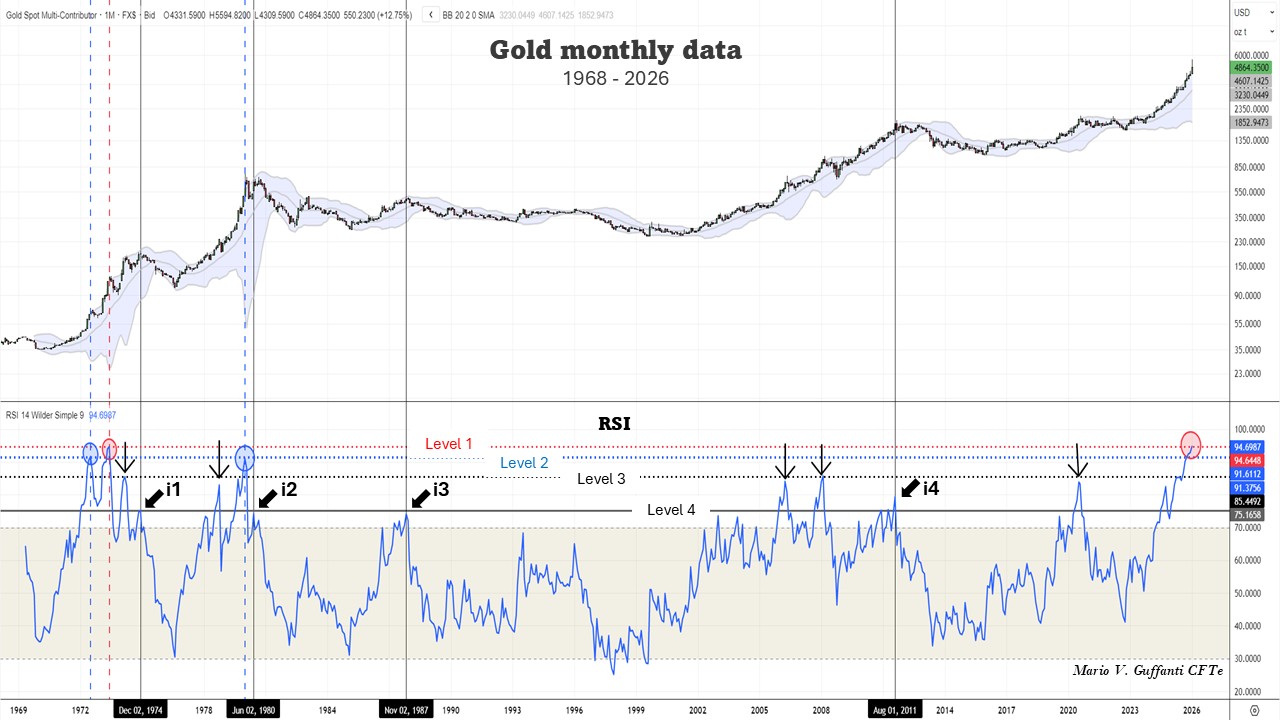
A review of monthly gold charts dating back to the late 1960s reveals striking parallels between the current trend and the early 1970s, notably during the Nixon Shock. This period was marked by President Nixon’s suspension of the dollar’s convertibility into gold, introducing “fiat money.” While today’s circumstances are not identical, these similarities provide valuable context for interpreting present market behavior.
Technical Indicators and Recurring Patterns
One effective approach to analyzing the current situation involves monitoring the Relative Strength Index (RSI) for overbought levels (above 70), which are often associated with subsequent price corrections. Corrections represent temporary movements counter to the prevailing trend, frequently bearish, but typically followed by a resumption of the bullish trajectory. Four significant RSI thresholds have been identified: the highest level (1) appeared only in 1973 and 2026; level 2 in 1972 and 1980; level 3 was reached in 1974, 1978, 2006, 2008, and 2020. Each time the RSI reversed at these levels, a correction within the ongoing bullish trend ensued. True trend reversals, however, were observed near level 4.
Historical Corrections and Reversals
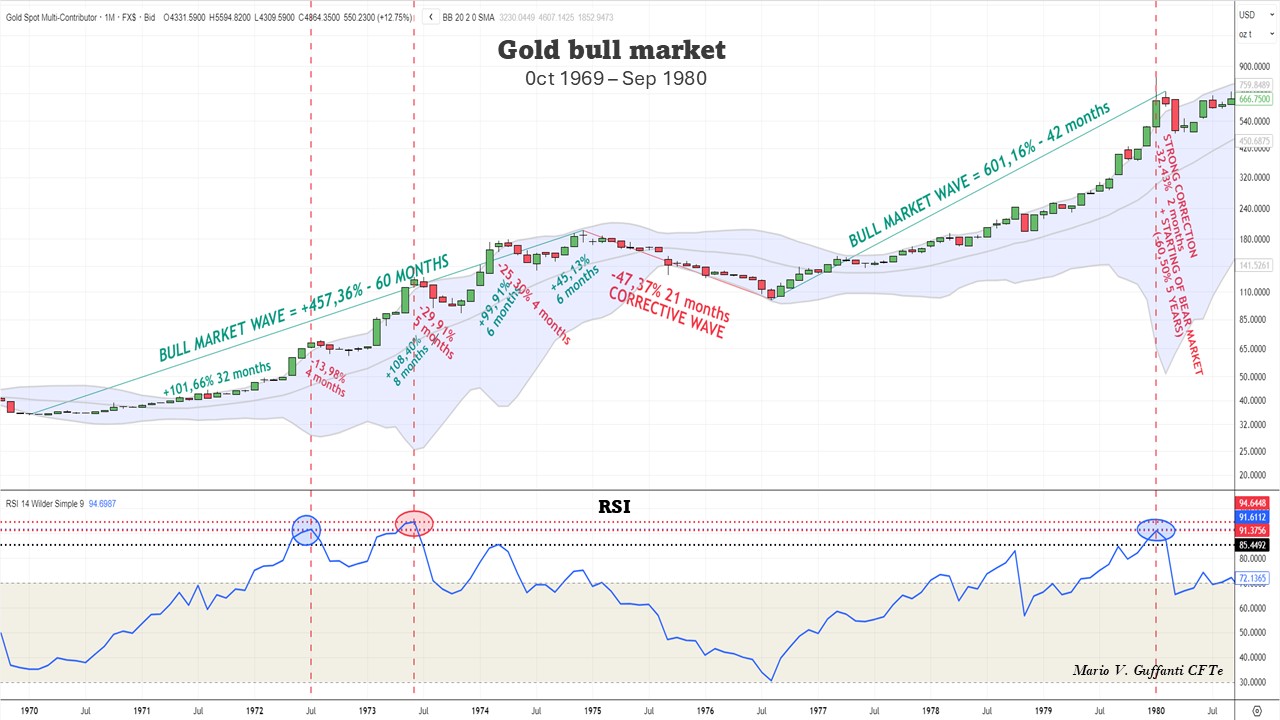
Unlike corrections, reversals mark the peak of a trend, after which a sustained bearish period typically follows. Gold has registered several reversals on monthly charts around level 4 (i1, i2, i3, and i4). Upon analysis, the first reversal (i1) may at first appear to be a correction, as the trend resumed afterward; however, its 21-month duration suggests it was indeed a true reversal, especially when compared to typical corrections, which lasted an average of about 5 months.
Corrections Based on Historical Trends
The corrections of the 1970s highlight the diversity and depth of market movements. The July 1972 correction lasted 4 months and saw a drop of 13.98%, primarily driven by profit-taking after significant growth. In June 1973, a 5-month correction resulted in a loss exceeding twice the previous one (-29.91%), again due to profit-taking and monetary stabilization measures. Another substantial correction occurred in April 1974, with a 25.30% loss over 4 months, followed by a long reversal beginning at the end of 1974 (-47.37% over 21 months), influenced by the announcement of IMF gold sales and reduced American demand following the legalization of gold ownership. The most profound correction marking the end of the 1970s’ bullish cycle took place in February 1980, when gold lost 32.43% in just two months. Gold’s ascent in the 1970s began with the Nixon Shock and ended with the Volcker Shock, when the Federal Reserve raised interest rates to 20%, making gold holdings costly. In the silver market, speculation by the Hunt brothers triggered further sales to cover margins.
Technical Analysis of Recent Silver Movements
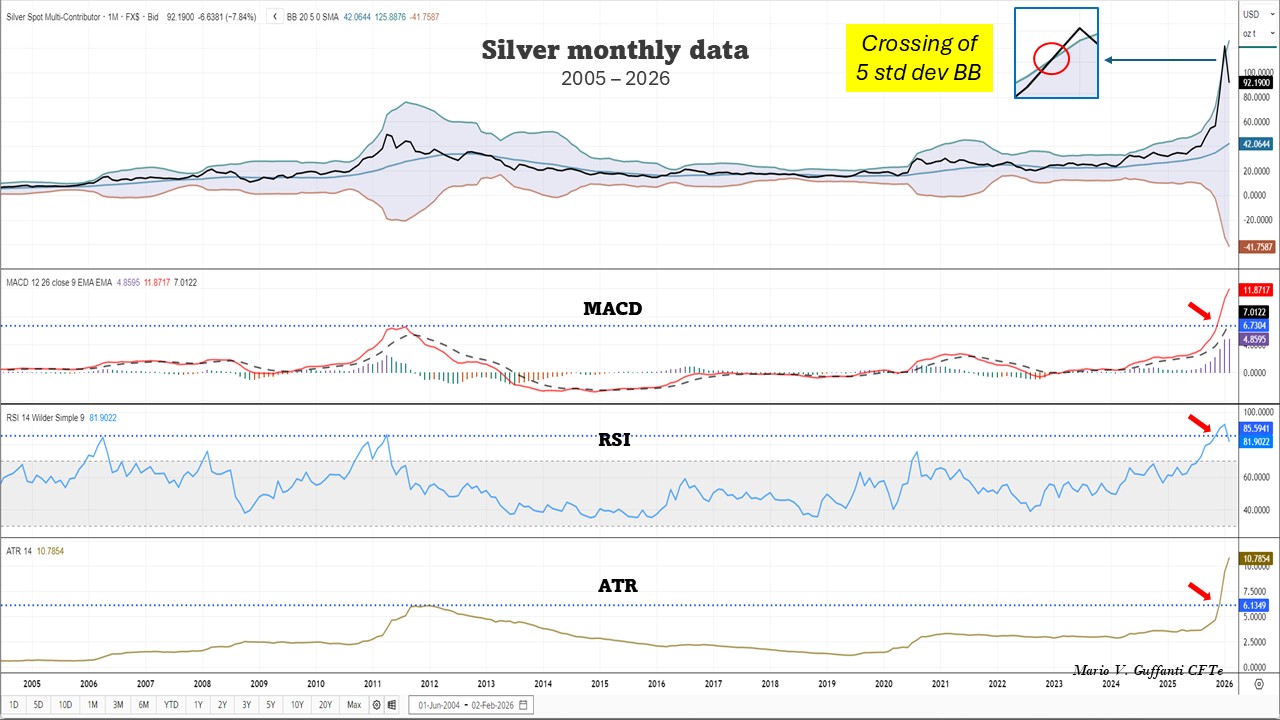
Alongside gold, silver has also reached extreme technical thresholds, exceeding the upper Bollinger band by five standard deviations. Key technical indicators—including RSI, MACD, and ATR—have reached twenty-year highs, signaling heightened volatility and risk.
Outlook: Correction or Reversal?
From a technical viewpoint, current signals point to a corrective phase rather than a genuine reversal, though confirmation will depend on forthcoming price actions. In January, the monthly candle closed in green, retaining about half of the gains, but such volatility requires time to be fully absorbed.
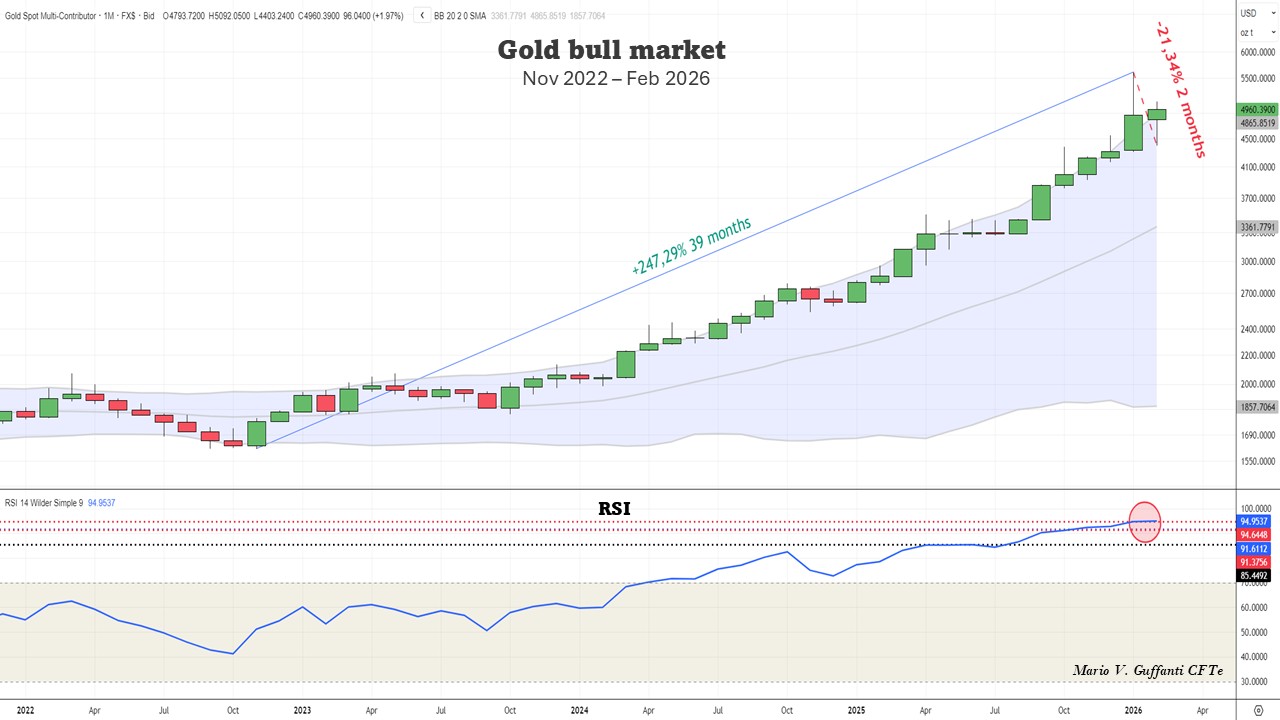
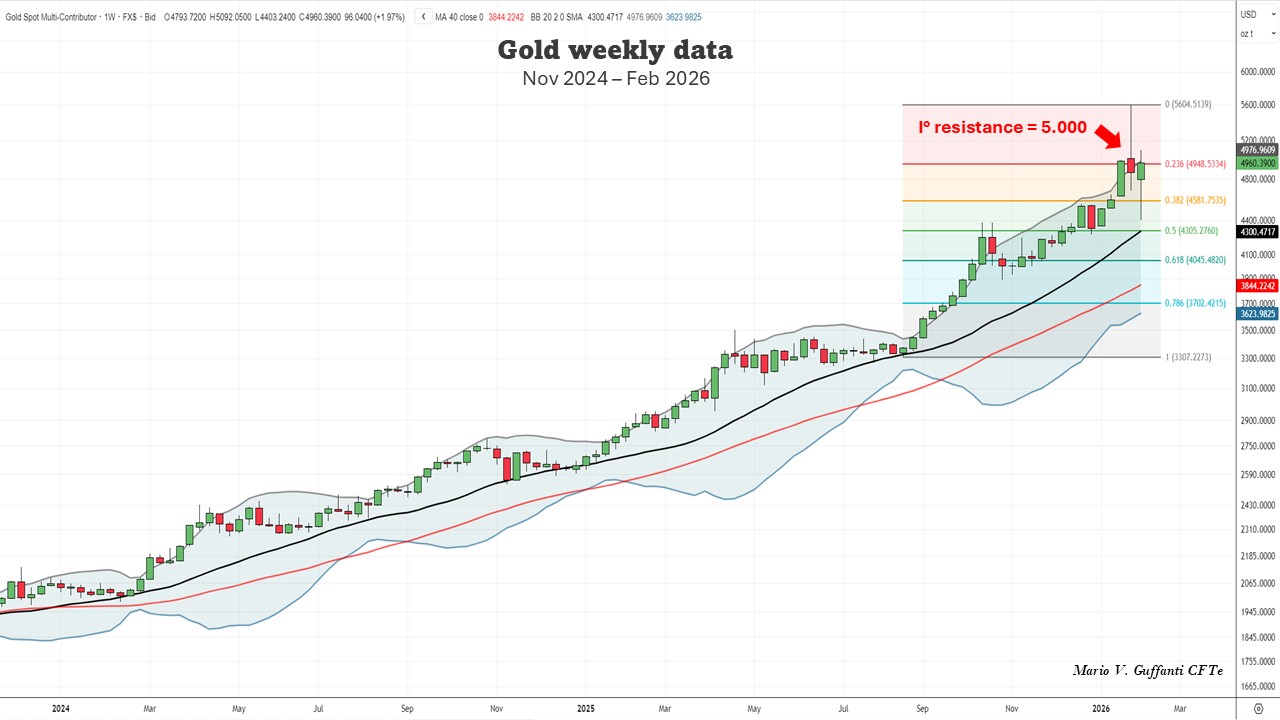
On the weekly chart, the 20-week moving average has served as reliable support during periods of weakness (black line). Prior to this, the Fibonacci level at 4581 (38.2%) offers an initial reference, followed by the 4305 level (50%), which aligns with the same moving average area. A two-thirds correction from a base of 3,300 would bring the price to 4045 (61.8%). Historically, these levels have supported the lateral movement of monthly candles and are considered primary support levels. The first resistance is located near 5,000, close to the initial Fibonacci retracement at 23.6%, where the last three weekly candles include two closing levels and one opening level.
Conclusion
Despite the current downtrend, gold continues to demonstrate an upward trajectory. It is interesting to note that the speed and intensity of the recent decline are reminiscent of those seen at the end of the 1980s, just before the market peak.
On that occasion, a combination of factors occurred that closely resemble those of today: on the one hand, innovative policies introduced by a new chairman of the Federal Reserve (a situation that could be repeated now with Warsh, whose appointment is yet to be ratified by the Senate); on the other hand, increased volatility in silver caused by the Hunt brothers’ speculation (showing similarities with recent speculation via ETFs and ETCs).
It is therefore essential to closely monitor both the evolution of interest rates — especially in relation to the possible confirmation of Warsh as head of the Federal Reserve — and future changes in volatility in the silver market. History shows how major revolutions in monetary policy, such as those led by Volcker, and strong speculative drives in silver, such as those by the Hunt brothers, have marked the end of extended market trends. As a well-known saying attributed to Mark Twain suggests: “history doesn’t repeat itself, but it often rhymes.”
Mario V. Guffanti CFTe, 7th February 2026
About the author

Mario Valentino Guffanti is a board member and Head of the Lugano Chapter. He is a financial advisor, technical analyst and researcher based in Milan, Italy. As an author of technical articles and lecturer as well as instructor in technical analysis courses in Switzerland, he is also dedicated to financial coaching through NLP techniques (neuro-linguistic programming).
Disclaimer: All methods, techniques, charts, analysis or results presented in this SAMT Blog are for educational purposes only. The information provided should not be construed in any way as a recommendation to buy or sell any financial instrument. You should always consult with your licensed financial advisor and tax advisor to determine the suitability of any investment to your particular financial situation. The author does not have a position in mentioned securities at the time of publication. Any opinions expressed herein are solely those of the author, and do not in any way represent the views or opinions of any other person or entity. SAMT and its affiliates, directors or agents will not be held liable or responsible for your investment decisions.
SAMT nor any of its affiliates, directors or agents are a financial advisory service, nor a licensed financial advisor and do not provide financial advice whatsoever in any financial product.
Further it should not be assumed that any methods, techniques or indicators presented will be profitable or that they will not result in losses. Past results of any individual trader or trading system presented are not indicative of future returns by that trader or system, and are not indicative of future returns which may or may not be realized by you.
Pictures uploaded and used in this article may be subject to copyright. The author itself is solely responsible for adhering to any applicable copyright laws.
By viewing the material on this page, you fully agree that you understand and consent to the above disclaimer.
 Women in TA Workshop
 IFTA 2026 conference in London, UK – SPECIAL PROMO
 S&P500 – Expected Green Path v. Red Path until the end of 2026