NVDA – a crash with an announcement – part 1
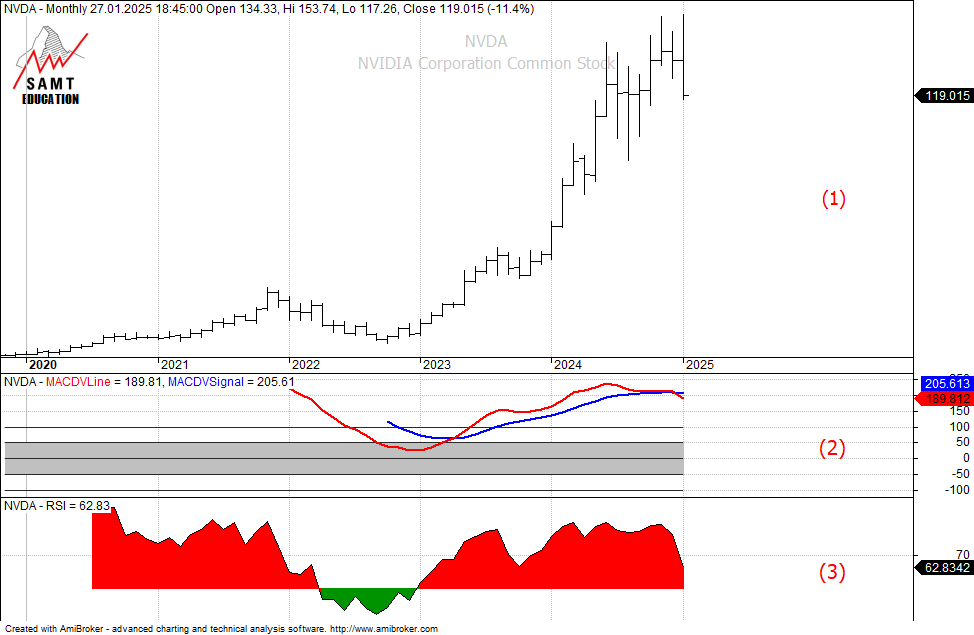
NVDA is a crash with an announcement – Monday’s crash in the stock of NVDA (currently -16%) took many investors by surprise. Suddenly everybody talks about the Deepseek AI story.
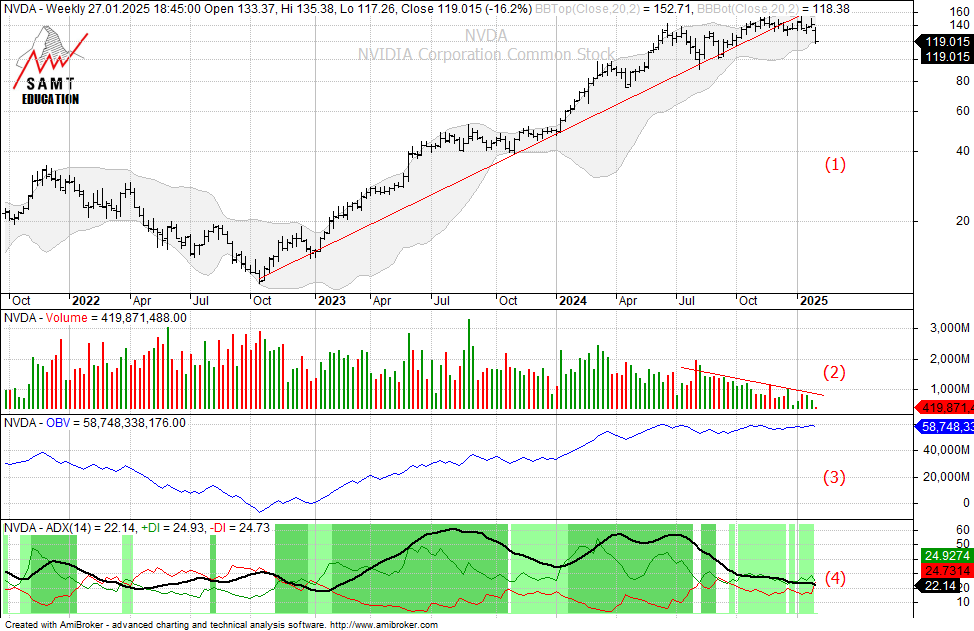
From a technician’s point of view, this was a crash with an announcement and in this article, I’m going to outline why.
About NVIDIA
NVIDIA Corp. engages in the design and manufacture of computer graphics processors, chipsets, and related multimedia software. It operates through the following segments: Graphics Processing Unit (GPU) and Compute & Networking. The Graphics segment includes GeForce GPUs for gaming and PCs, the GeForce NOW game streaming service and related infrastructure, Quadro and NVIDIA RTX GPUs for enterprise workstation graphics, virtual GPU, or vGPU, software for cloud-based visual and virtual computing, automotive platforms for infotainment systems, and Omniverse Enterprise software for building and operating metaverse and 3D internet applications. The Compute & Networking segment consists of Data Center accelerated computing platforms and end-to-end networking platforms including Quantum for InfiniBand and Spectrum for Ethernet, NVIDIA DRIVE automated-driving platform and automotive development agreements, Jetson robotics and other embedded platforms, NVIDIA AI Enterprise and other software, and DGX Cloud software and services. The company was founded by Jen Hsun Huang, Chris A. Malachowsky, and Curtis R. Priem in April 1993 and is headquartered in Santa Clara, CA.
https://www.nvidia.com
NVIDIA (NVDA) – a crash with an announcement
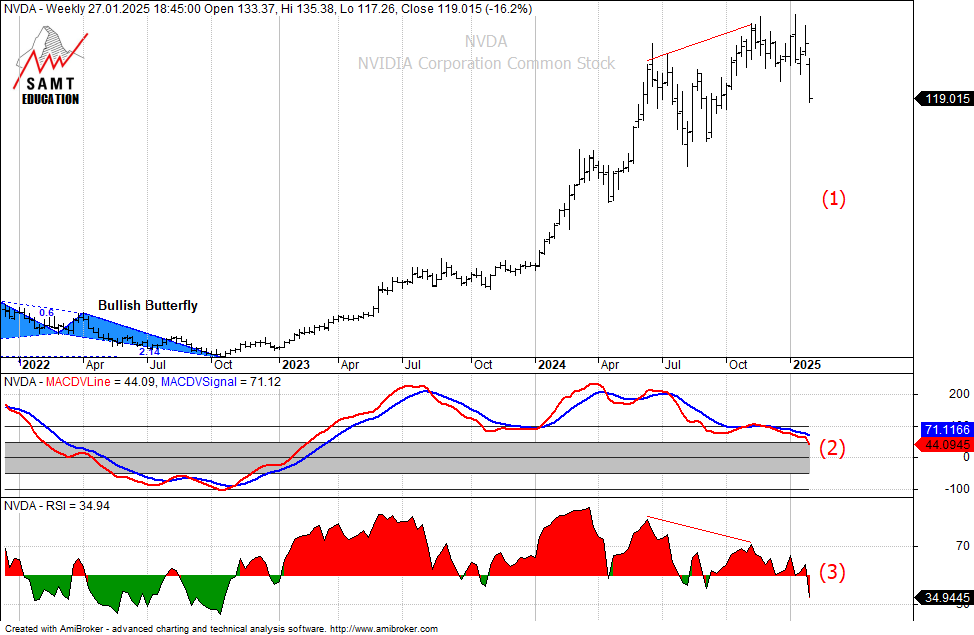
What other warning signs not to ignore
What’s next?
The questions many worried investors ask is “how far will the NVDA stock drop?” or “what’s next?”
I will outline this in part 2 of my article – an article reserved for members only.
Study Technical Analysis and become a Pro!
Not a member yet? Join SAMT now and learn Technical Analysis to be prepared next time the market warns you about your investments.
You can learn about Technical Analysis in a self-study process following the reading list for our CFTe diploma or online in a convenient Home Study Course and get further member benefits such as exclusive discounts and the possibility to join the global IFTA conference.
About the author

Patrick Pfister is the President of the Swiss Association of Market Technicians (SAMT) and a seasoned technical analyst based in Zurich, Switzerland with a passion for unraveling the complexities of financial markets through data-driven insights and analytical expertise. With a solid academic background in mathematics and computer science, combined with more than 20 years of hands-on experience in the financial industry, Patrick has established himself as a trusted authority in the field of technical analysis.
Patrick embarked on a career that has seen his work with top financial institutions, where he has honed his skills in interpreting market trends, identifying patterns, and developing innovative trading strategies. His deep understanding of statistical models, quantitative analysis, and risk management has enabled him to make sound investment decisions in dynamic market environments.
Patrick is known for his meticulous attention to detail, his ability to communicate complex concepts in a clear and concise manner, and his commitment to staying at the forefront of technological advancements in the financial industry. He is a sought-after speaker at industry conferences and seminars, where he shares his knowledge and expertise with fellow professionals and aspiring analysts.
In addition to his work as a technical analyst, Patrick is also a mentor and educator, guiding the next generation of analysts and researchers in the field of financial analysis. His dedication to fostering talent and promoting excellence in the industry is a testament to his commitment to advancing the field of technical analysis.
Outside of his professional endeavors, Patrick is an avid traveler, an aviation enthusiast, and a lifelong learner who is always seeking new challenges and opportunities for personal growth. He believes in the power of continuous learning, adaptability, and perseverance as the keys to success in both the financial markets and in life.
Patrick's unwavering dedication to excellence, his innovative approach to technical analysis, predicated on multiple-timeframe turnaround patterns, and his passion for empowering others makes him a true asset to the financial industry and a respected figure in the world of technical analysis.
Having published his research through a Wallstreet research company, you will find his posts now regularly on LinkedIn as well as on the BLOG of SAMT-org.ch.
Disclaimer: All methods, techniques, charts, analysis or results presented in this SAMT Blog are for educational purposes only. The information provided should not be construed in any way as a recommendation to buy or sell any financial instrument. You should always consult with your licensed financial advisor and tax advisor to determine the suitability of any investment to your particular financial situation. The author does not have a position in mentioned securities at the time of publication. Any opinions expressed herein are solely those of the author, and do not in any way represent the views or opinions of any other person or entity. SAMT and its affiliates, directors or agents will not be held liable or responsible for your investment decisions.
SAMT nor any of its affiliates, directors or agents are a financial advisory service, nor a licensed financial advisor and do not provide financial advice whatsoever in any financial product.
Further it should not be assumed that any methods, techniques or indicators presented will be profitable or that they will not result in losses. Past results of any individual trader or trading system presented are not indicative of future returns by that trader or system, and are not indicative of future returns which may or may not be realized by you.
Pictures uploaded and used in this article may be subject to copyright. The author itself is solely responsible for adhering to any applicable copyright laws.
By viewing the material on this page, you fully agree that you understand and consent to the above disclaimer.
 Women in TA Workshop
 IFTA 2026 conference in London, UK – SPECIAL PROMO
 S&P500 – Expected Green Path v. Red Path until the end of 2026