S&P 500: Markets in Turmoil
What happened on Monday 07th of April?
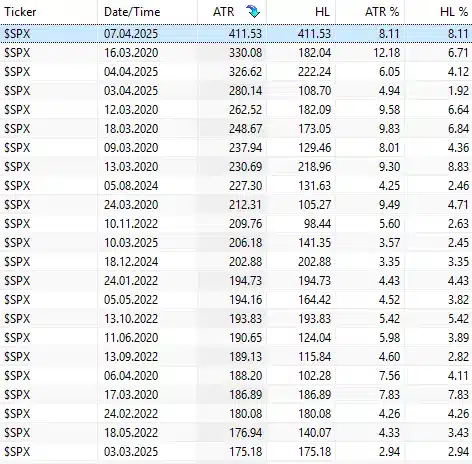
That day hit many investors by surprise and with a shock at the same time, as markets like the S&P 500 were in turmoil. In fact, depending how you measure it, it was the most volatile trading day and also a huge decline in the entire past 40 years! You can simply measure the volatility of the day in an absolute way by substracting the high from the low and compare that the previous close, you can do it on a percentage basis or even better use the Average True Range (ATR) indicator to get the results.
The biggest one?
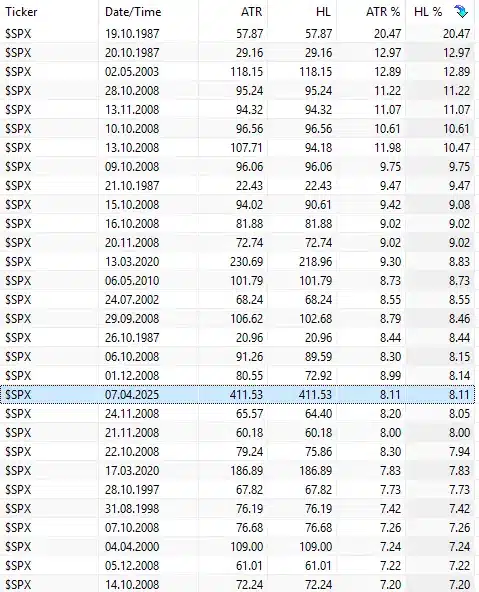
Now wait a minute! People who have been long time in the market will say “the crash of 1987 was much bigger!”.
True that if you measure the 1 day percentage change from close to close. The black Monday of October 19th, 1987 had an ATR% of over 20%!
But don’t forget, there are many type of investors who will look at the market from different angles:
- stock investors have lost some of their assets on April 7th, but 1987 would have wiped out a much larger part of their investments, as the percentage change was bigger and therefore more relevant.
- future investors base their calculations in basis points (bips), so for them the absolute change is more important than the percentage one when comparing declining market days. So April 7th will remain in their memories as the worst trading day of the last 40 years (so far…).
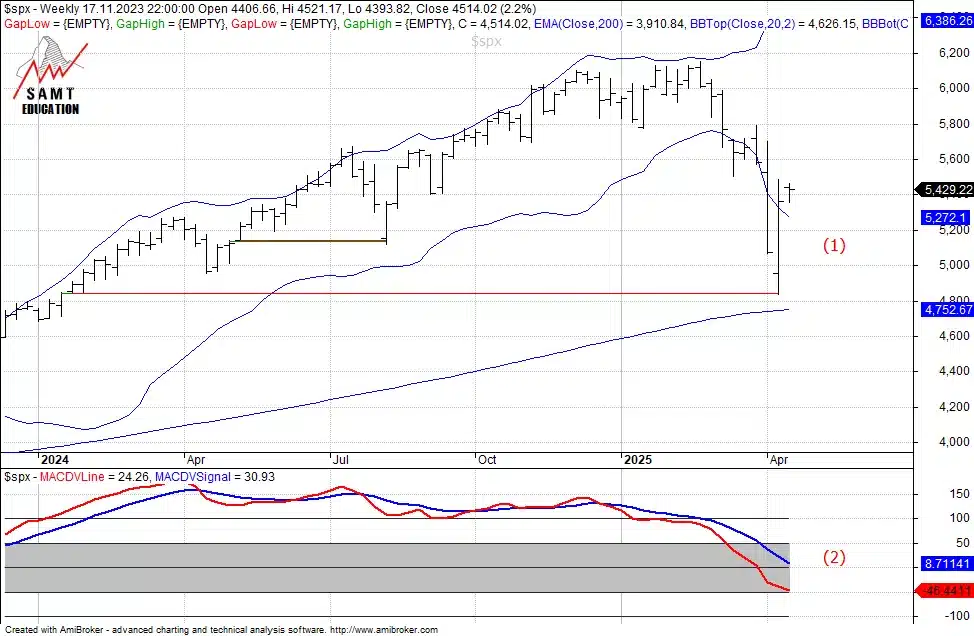
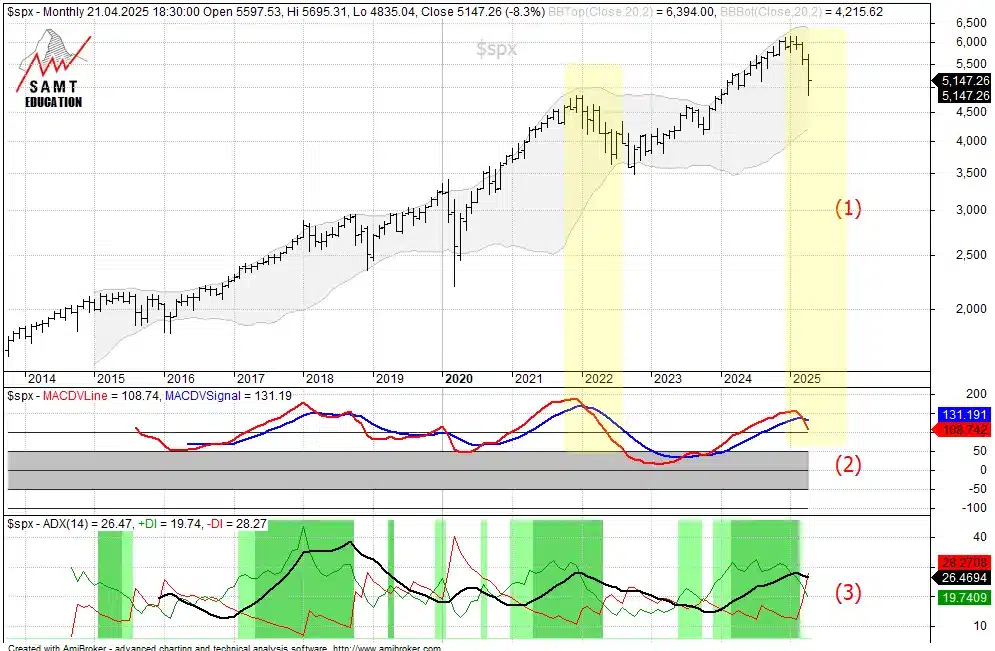
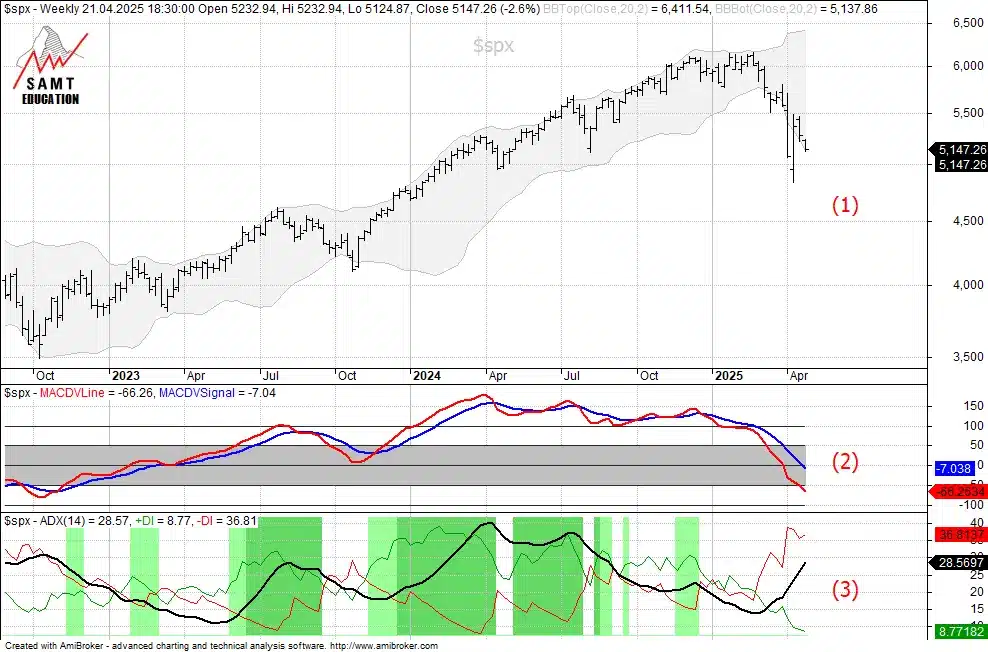
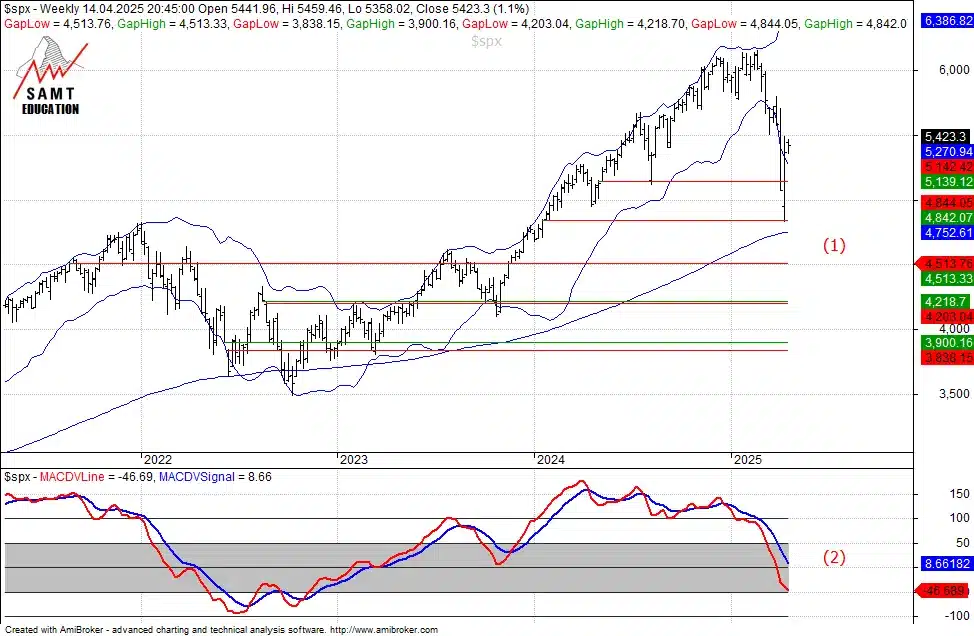
I leave it up to you to decide which market crash ranks higher or lower in your personal trading history. All of the significant trading days have one thing in common though: they mark long term change. Here’s a few long-term charts showing you what the market looks like from a technical point of view:
S&P 500: Markets in Turmoil Analysis and Insights – what to look out for next
Summary
Remember that markets are crazy and driven >90% by algos, not by human investors. This will simply lead to even MORE volatility and quick reactions.
I have seen crazy things happening in the market: one day, the market looks like it’s about to crash, a day and a major economic news later it reversed completely and suddenly looks like we’re going to the moon. The problem is not technical analysis, but how we apply it to analyze markets.
A monthly signal is only confirmed at the end of the month, once new data for the next bar (new month) is coming in. Just like you won’t judge the daily market action based on early morning data only.
So while the weekly charts look pretty bad already, we are slipping into bad monthly charts as well. It’s not a straight line down though, but more of a 3 steps down, 2 steps up behavior. We know that the current politicians can have a significant impact with their statements. New tariffs or sudden new trade-free agreements? Both news can lead to volatile days, but don’t forget: many companies have reached valuations that remind us of the dotcom area. Lower markets would be in the sense of US-politics.
My expectations for the time ahead:
- lower markets over time (sell in May and go away? Summer vacation month with low trading volume. September is historically a bad month for trading,…)
- rising volatility
- short term corrections with big up swings (any news about a new trade agreement, or company’s earning “less bad than expected” can trigger this)
Study Technical Analysis and become a Pro!
Not a member yet? Join SAMT now and learn Technical Analysis to be prepared next time the market warns you about your investments.
You can learn about Technical Analysis in a self-study process following the reading list for our CFTe diploma or online in a convenient Home Study Course and get further member benefits such as exclusive discounts and the possibility to join the global IFTA conference.
About the author

Patrick Pfister is the President of the Swiss Association of Market Technicians (SAMT) and a seasoned technical analyst based in Zurich, Switzerland with a passion for unraveling the complexities of financial markets through data-driven insights and analytical expertise. With a solid academic background in mathematics and computer science, combined with more than 20 years of hands-on experience in the financial industry, Patrick has established himself as a trusted authority in the field of technical analysis.
Patrick embarked on a career that has seen his work with top financial institutions, where he has honed his skills in interpreting market trends, identifying patterns, and developing innovative trading strategies. His deep understanding of statistical models, quantitative analysis, and risk management has enabled him to make sound investment decisions in dynamic market environments.
Patrick is known for his meticulous attention to detail, his ability to communicate complex concepts in a clear and concise manner, and his commitment to staying at the forefront of technological advancements in the financial industry. He is a sought-after speaker at industry conferences and seminars, where he shares his knowledge and expertise with fellow professionals and aspiring analysts.
In addition to his work as a technical analyst, Patrick is also a mentor and educator, guiding the next generation of analysts and researchers in the field of financial analysis. His dedication to fostering talent and promoting excellence in the industry is a testament to his commitment to advancing the field of technical analysis.
Outside of his professional endeavors, Patrick is an avid traveler, an aviation enthusiast, and a lifelong learner who is always seeking new challenges and opportunities for personal growth. He believes in the power of continuous learning, adaptability, and perseverance as the keys to success in both the financial markets and in life.
Patrick's unwavering dedication to excellence, his innovative approach to technical analysis, predicated on multiple-timeframe turnaround patterns, and his passion for empowering others makes him a true asset to the financial industry and a respected figure in the world of technical analysis.
Having published his research through a Wallstreet research company, you will find his posts now regularly on LinkedIn as well as on the BLOG of SAMT-org.ch.
Disclaimer: All methods, techniques, charts, analysis or results presented in this SAMT Blog are for educational purposes only. The information provided should not be construed in any way as a recommendation to buy or sell any financial instrument. You should always consult with your licensed financial advisor and tax advisor to determine the suitability of any investment to your particular financial situation. The author does not have a position in mentioned securities at the time of publication. Any opinions expressed herein are solely those of the author, and do not in any way represent the views or opinions of any other person or entity. SAMT and its affiliates, directors or agents will not be held liable or responsible for your investment decisions.
SAMT nor any of its affiliates, directors or agents are a financial advisory service, nor a licensed financial advisor and do not provide financial advice whatsoever in any financial product.
Further it should not be assumed that any methods, techniques or indicators presented will be profitable or that they will not result in losses. Past results of any individual trader or trading system presented are not indicative of future returns by that trader or system, and are not indicative of future returns which may or may not be realized by you.
Pictures uploaded and used in this article may be subject to copyright. The author itself is solely responsible for adhering to any applicable copyright laws.
By viewing the material on this page, you fully agree that you understand and consent to the above disclaimer.
 Women in TA Workshop
 IFTA 2026 conference in London, UK – SPECIAL PROMO
 S&P500 – Expected Green Path v. Red Path until the end of 2026