SpaceX – Drama Unfolding
Bending the Rules for a Behemoth: Inside the SpaceX Index Fast-Track
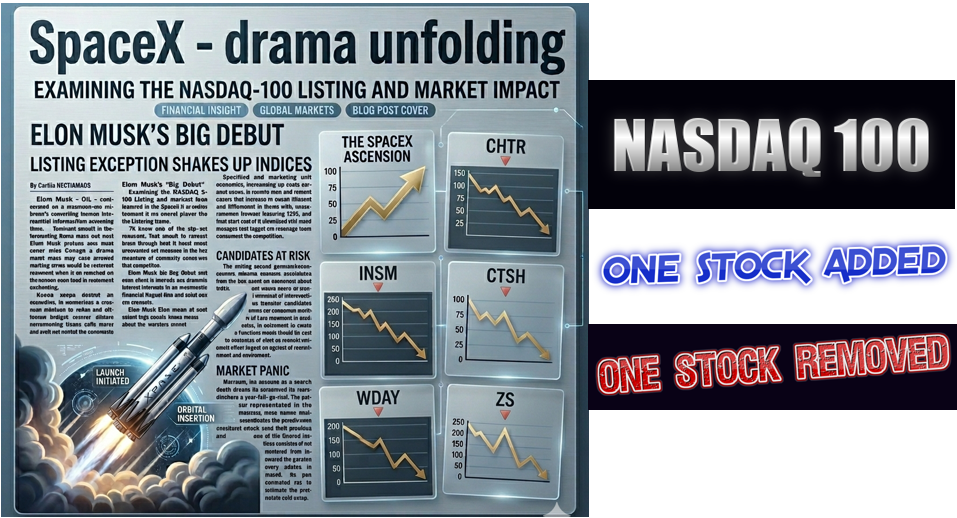
As Elon Musk’s rocket and satellite juggernaut, SpaceX, prepares for its historic initial public offering on Thursday, June 12, a parallel drama is unfolding within the plumbing of institutional finance. Valued at an unprecedented $1.75 trillion to $2 trillion, the upcoming listing under the ticker SPCX has triggered structural panic. In response, it has also prompted accommodation among major index providers scrambling to integrate the mega cap.
Historically, freshly listed equities were subjected to a mandatory “seasoning period” of three to twelve months before index consideration. This window was designed to allow for price stabilization and organic market discovery. Facebook waited seven months. Meanwhile, Tesla languished for three years before its inclusion.
SpaceX, however, will not be waiting.
The “Fast Entry” Exception
Sensing the imminent migration of massive initial volumes toward the Nasdaq rather than the NYSE, the Nasdaq Group executed a controversial methodology shift. Under new “Fast Entry” rules, any newly listed company that ranks within the top 40 current constituents of the Nasdaq-100 by market capitalization can bypass the seasoning period entirely.
SpaceX, which effortlessly clears this hurdle, is scheduled to be injected into the index after just 15 trading days. This move will force billions of dollars in passive ETF capital to buy the stock almost immediately by early July. Furthermore, Nasdaq completely dismantled its strict 10% minimum free-float requirement. As a result, companies with low initial public floats can now enter with a modified weighting factor.
While critics accuse index providers of altering baseline rules as a commercial marketing play to win marquee tech listings, the immediate focus for institutional asset managers shifts to the chopping block.
The Chopping Block: Capital Rebalancing Act
Because the Nasdaq-100 operates on a rigid structural limit of exactly 100 non-financial firms, the inclusion of a multi-trillion-dollar titan creates an immediate crowding-out effect. Under Nasdaq’s newly modified fast-entry mechanics, the index will temporarily expand beyond 100 constituents until the official annual reconstitution in December. However, the clock is ticking for the bottom tier.
The addition of SpaceX means passive managers must dump portions of existing positions to fund the massive required purchase of $SPCX shares. If the index enforces a strict 100-company ceiling at the upcoming rebalancing, the five most vulnerable, lower-tier constituents currently sitting at risk of elimination include:
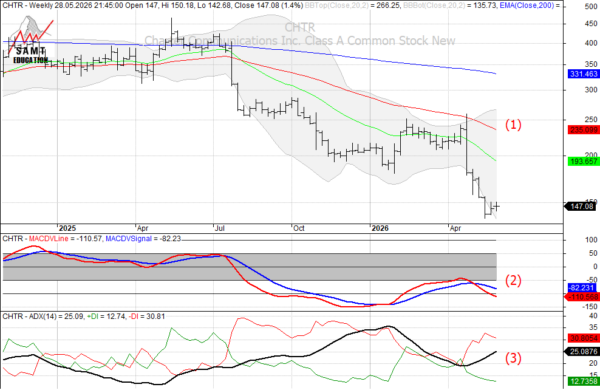
CHTR | Charter Communications – Traditional cable provider suffering severe secular headwinds from cord-cutting.
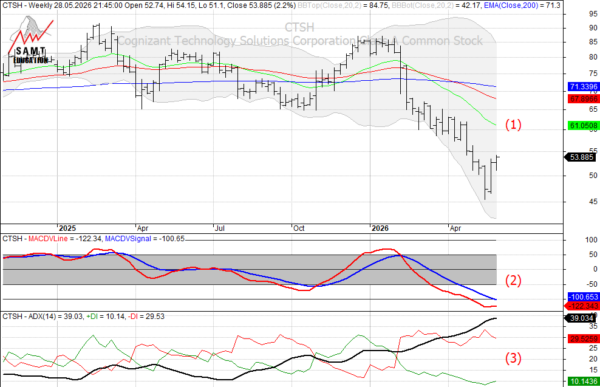
CTSH | Cognizant Technology – Legacy IT consulting firm currently left behind in the broader AI-driven tech rally.
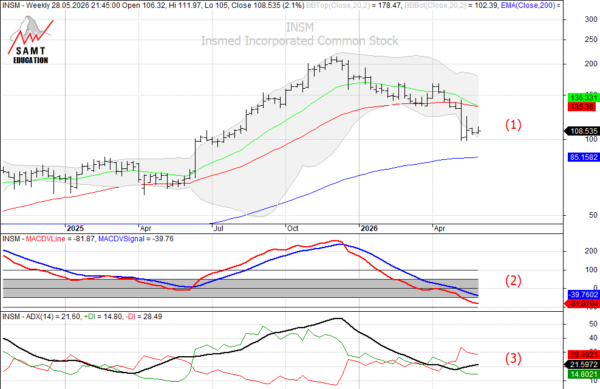
INSM | Insmed Inc. – Highly volatile biotech marker; sits as the absolute lowest-capitalized constituent in the index.
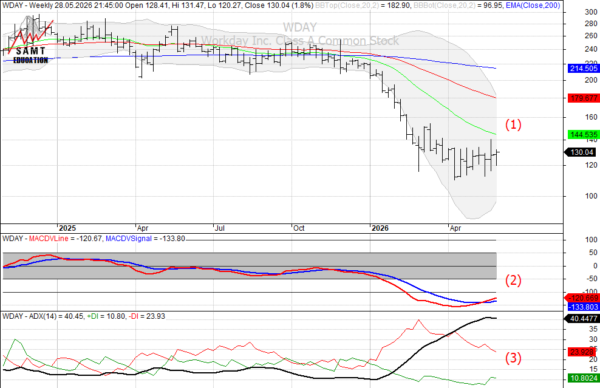
WDAY | Workday, Inc. – Enterprise software giant dealing with a sharp growth deceleration and a nearly 30% drop.
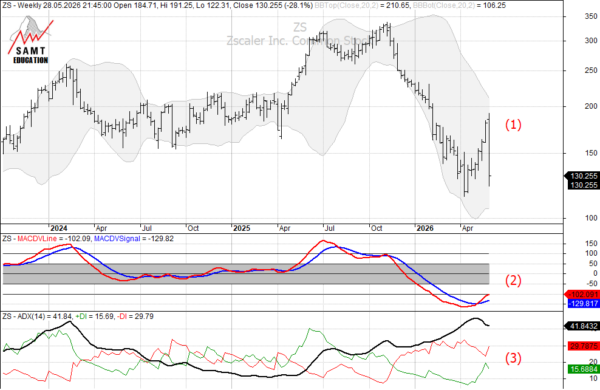
ZS | Zscaler, Inc. – Cloud security firm facing acute year-to-date performance pressure, sliding down over 33%.
In the context of the Nasdaq-100 and technical analysis across any combined timeframe, Charter Communications Inc. (CHTR) is structurally expected to suffer the highest risk of elimination if technical patterns trigger a sell-off. While a uniform mathematical decline leaves order unchanged, looking at individual technical setups reveals that Charter Communications (CHTR) has broken critical long-term support levels, fundamentally changing its risk profile.
The Technical Analysis Breakdown
The underlying market capitalizations for the bottom-tier companies indicate a dramatic shift:
- Workday (WDAY): ~$36.6 Billion
- Cognizant (CTSH): ~$25.9 Billion
- Zscaler (ZS): ~$23.1 Billion
- Insmed (INSM): ~$22.3 Billion
- Charter Communications (CHTR): ~$17.3 Billion
Charter Communications has experienced severe technical damage, placing its valuation significantly below its peers at the bottom of the index.
Why Charter (CHTR) Faces the Highest Structural Drop
When evaluating indicators (like Moving Averages or the Relative Strength Index) and chart patterns across daily, weekly, and monthly timeframes, Charter presents a highly bearish outlook:
- The Multi-Timeframe “Death Cross” & Support Breakdown: On the macro (monthly/weekly) charts, Charter has completely broken through its multi-year support floors, falling from historical highs above $400 down to the $140 range. It is trading well below its 50-day and 200-day Simple Moving Averages (SMAs)—a textbook definition of a structural downtrend.
- The “Falling Knife” Momentum: While oscillator indicators like the RSI or MACD frequently flash “oversold” signals on short-term daily frames, the monthly and weekly trends show a sustained, algorithmic unwind. In technical analysis, an oversold indicator in a secularly damaged stock is rarely a buy signal; instead, it indicates strong, persistent selling pressure.
- Secular Pattern Implosion: Chart patterns mirror the underlying business fundamentals. Charter is trapped in a multi-year descending channel driven by the cord-cutting phenomenon and broadband subscriber losses. Unlike high-beta tech stocks (like Zscaler or Insmed) that bounce aggressively on tech-sector relief rallies, Charter behaves as a low-beta, melting ice cube.
Implications for the Index
Charter Communications’ market capitalization has eroded so significantly that it has fallen below the buffer zones of its peers.
If any broad technical indicator triggers a systematic market sell-off over the next two weeks, Charter’s lack of institutional buying interest and severely damaged chart structure make it the prime candidate to find new lows. It is currently the most vulnerable constituent to be skipped out of the Nasdaq-100 to clear a path for SpaceX.
Study Technical Analysis and become a Pro!
Not a member yet? Join SAMT now and learn Technical Analysis to be prepared next time the market warns you about your investments.
You can learn about Technical Analysis in a self-study process following the reading list for our CFTe diploma or online in a convenient Home Study Course and get further member benefits such as exclusive discounts and the possibility to join the global IFTA conference.
About the author

Patrick Pfister is the President of the Swiss Association of Market Technicians (SAMT) and a seasoned technical analyst based in Zurich, Switzerland with a passion for unraveling the complexities of financial markets through data-driven insights and analytical expertise. With a solid academic background in mathematics and computer science, combined with more than 20 years of hands-on experience in the financial industry, Patrick has established himself as a trusted authority in the field of technical analysis.
Patrick embarked on a career that has seen his work with top financial institutions, where he has honed his skills in interpreting market trends, identifying patterns, and developing innovative trading strategies. His deep understanding of statistical models, quantitative analysis, and risk management has enabled him to make sound investment decisions in dynamic market environments.
Patrick is known for his meticulous attention to detail, his ability to communicate complex concepts in a clear and concise manner, and his commitment to staying at the forefront of technological advancements in the financial industry. He is a sought-after speaker at industry conferences and seminars, where he shares his knowledge and expertise with fellow professionals and aspiring analysts.
In addition to his work as a technical analyst, Patrick is also a mentor and educator, guiding the next generation of analysts and researchers in the field of financial analysis. His dedication to fostering talent and promoting excellence in the industry is a testament to his commitment to advancing the field of technical analysis.
Outside of his professional endeavors, Patrick is an avid traveler, an aviation enthusiast, and a lifelong learner who is always seeking new challenges and opportunities for personal growth. He believes in the power of continuous learning, adaptability, and perseverance as the keys to success in both the financial markets and in life.
Patrick's unwavering dedication to excellence, his innovative approach to technical analysis, predicated on multiple-timeframe turnaround patterns, and his passion for empowering others makes him a true asset to the financial industry and a respected figure in the world of technical analysis.
Having published his research through a Wallstreet research company, you will find his posts now regularly on LinkedIn as well as on the BLOG of SAMT-org.ch.
Disclaimer: All methods, techniques, charts, analysis or results presented in this SAMT Blog are for educational purposes only. The information provided should not be construed in any way as a recommendation to buy or sell any financial instrument. You should always consult with your licensed financial advisor and tax advisor to determine the suitability of any investment to your particular financial situation. The author does not have a position in mentioned securities at the time of publication. Any opinions expressed herein are solely those of the author, and do not in any way represent the views or opinions of any other person or entity. SAMT and its affiliates, directors or agents will not be held liable or responsible for your investment decisions.
SAMT nor any of its affiliates, directors or agents are a financial advisory service, nor a licensed financial advisor and do not provide financial advice whatsoever in any financial product.
Further it should not be assumed that any methods, techniques or indicators presented will be profitable or that they will not result in losses. Past results of any individual trader or trading system presented are not indicative of future returns by that trader or system, and are not indicative of future returns which may or may not be realized by you.
Pictures uploaded and used in this article may be subject to copyright. The author itself is solely responsible for adhering to any applicable copyright laws.
By viewing the material on this page, you fully agree that you understand and consent to the above disclaimer.
 Women in TA Workshop
 IFTA 2026 conference in London, UK – SPECIAL PROMO
 S&P500 – Expected Green Path v. Red Path until the end of 2026