Unlocking Market Trends: The Power of Volume Accumulation in Trading
The Power of Volume Accumulation in Trading: volume accumulation is a powerful concept in stock market analysis that helps traders and investors assess the strength of price movements. By analyzing the trading volume alongside price changes, volume accumulation can provide insights into market trends, buyer and seller activity, and potential reversals. Understanding how volume interacts with price is essential for identifying whether a stock is being actively bought (accumulated) or sold (distributed), offering valuable clues for making informed investment decisions. In this article, we’ll explore the role of volume accumulation and how it can enhance your trading strategy.
What indicators are used to measure volume accumulation?
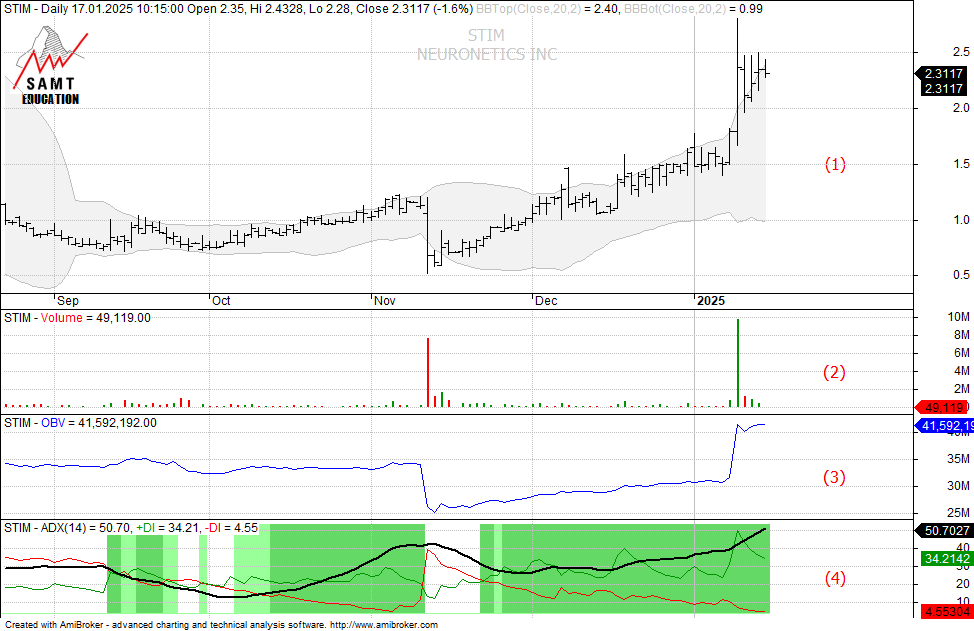
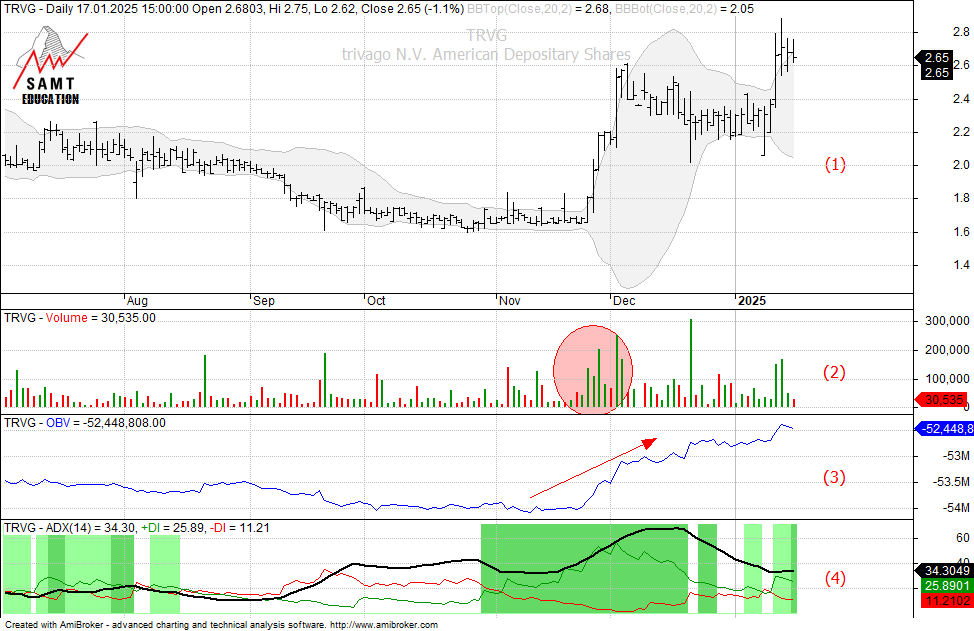
While there are pros and cons for each indicator, we will limit our analysis using the OBV-indicator on the following two stocks: Neuronetics (STIM) and Trivago (TRVG).
About Neuronetics
Neuronetics, Inc. is a commercial stage medical technology company, which focuses on designing, developing, and marketing products that improve the quality of life for patients who suffer from neurohealth disorders. It operates through United States and International geographical segments. The company was founded by Steven B. Waite, Bruce J. Shook, Norman R. Weldon, and Thomas D. Weldon in 1998 and is headquartered in Malvern, PA.
https://neurostar.com/neuronetics/
Neuronetics (STIM) – a good example for The Power of Volume Accumulation
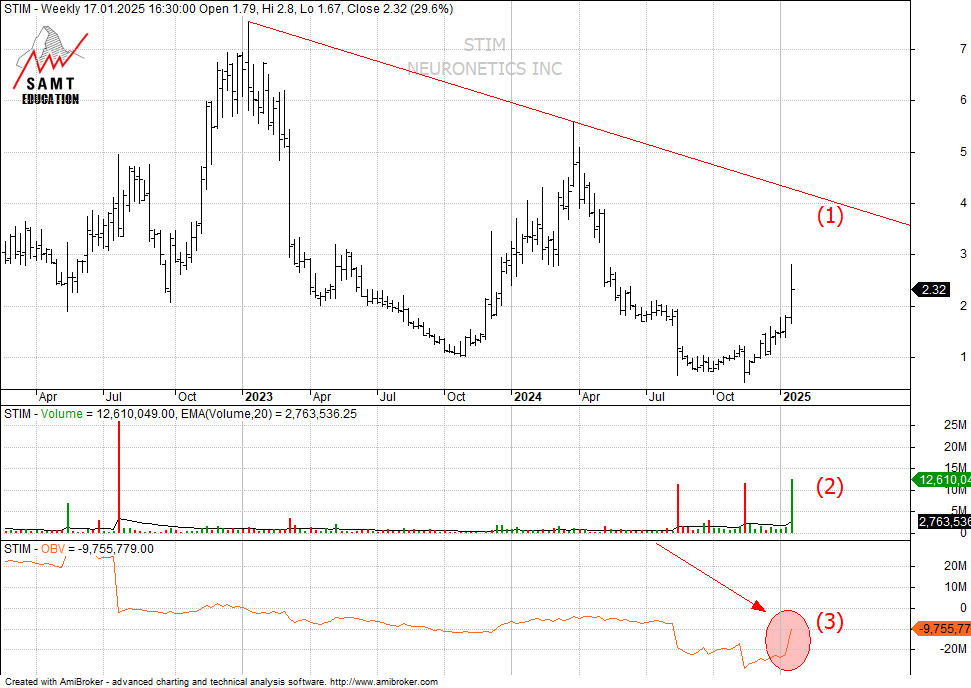
What else to consider about Neuronetics (STIM)
About Trivago
trivago NV is a holding company, which engages in the provision of a global hotel and accommodation search platform. It also offers marketing tools and services for advertisers. The company was founded by Rolf T.J. Schromgens, Peter Vinnemeier, and Stephan Stubner in 2005 and is headquartered in Dusseldorf, Germany.
https://www.trivago.com/
Trivago (TRVG) – another example for The Power of Volume Accumulation in Trading
Conclusion
In conclusion, volume analysis is a critical tool for understanding market sentiment and identifying potential price trends. The On-Balanced Volume (OBV) indicator offers a unique advantage by combining price movements and volume to provide a clear picture of buying and selling pressure. By tracking the cumulative volume flow, OBV can help traders detect early signs of price trends or reversals, as it reflects whether volume is supporting or contradicting price actions. This makes OBV a valuable tool for confirming trends and enhancing decision-making in trading strategies.
The good thing about volume analysis is it has low correlation to traditional indicators and thus giving you an additional input. Never use volume analysis in an isolated way, always combine it with other indicators to form a solid analysis and to unlock the full power of volume accumulation.
About the author

Patrick Pfister is the President of the Swiss Association of Market Technicians (SAMT) and a seasoned technical analyst based in Zurich, Switzerland with a passion for unraveling the complexities of financial markets through data-driven insights and analytical expertise. With a solid academic background in mathematics and computer science, combined with more than 20 years of hands-on experience in the financial industry, Patrick has established himself as a trusted authority in the field of technical analysis.
Patrick embarked on a career that has seen his work with top financial institutions, where he has honed his skills in interpreting market trends, identifying patterns, and developing innovative trading strategies. His deep understanding of statistical models, quantitative analysis, and risk management has enabled him to make sound investment decisions in dynamic market environments.
Patrick is known for his meticulous attention to detail, his ability to communicate complex concepts in a clear and concise manner, and his commitment to staying at the forefront of technological advancements in the financial industry. He is a sought-after speaker at industry conferences and seminars, where he shares his knowledge and expertise with fellow professionals and aspiring analysts.
In addition to his work as a technical analyst, Patrick is also a mentor and educator, guiding the next generation of analysts and researchers in the field of financial analysis. His dedication to fostering talent and promoting excellence in the industry is a testament to his commitment to advancing the field of technical analysis.
Outside of his professional endeavors, Patrick is an avid traveler, an aviation enthusiast, and a lifelong learner who is always seeking new challenges and opportunities for personal growth. He believes in the power of continuous learning, adaptability, and perseverance as the keys to success in both the financial markets and in life.
Patrick's unwavering dedication to excellence, his innovative approach to technical analysis, predicated on multiple-timeframe turnaround patterns, and his passion for empowering others makes him a true asset to the financial industry and a respected figure in the world of technical analysis.
Having published his research through a Wallstreet research company, you will find his posts now regularly on LinkedIn as well as on the BLOG of SAMT-org.ch.
Disclaimer: All methods, techniques, charts, analysis or results presented in this SAMT Blog are for educational purposes only. The information provided should not be construed in any way as a recommendation to buy or sell any financial instrument. You should always consult with your licensed financial advisor and tax advisor to determine the suitability of any investment to your particular financial situation. The author does not have a position in mentioned securities at the time of publication. Any opinions expressed herein are solely those of the author, and do not in any way represent the views or opinions of any other person or entity. SAMT and its affiliates, directors or agents will not be held liable or responsible for your investment decisions.
SAMT nor any of its affiliates, directors or agents are a financial advisory service, nor a licensed financial advisor and do not provide financial advice whatsoever in any financial product.
Further it should not be assumed that any methods, techniques or indicators presented will be profitable or that they will not result in losses. Past results of any individual trader or trading system presented are not indicative of future returns by that trader or system, and are not indicative of future returns which may or may not be realized by you.
Pictures uploaded and used in this article may be subject to copyright. The author itself is solely responsible for adhering to any applicable copyright laws.
By viewing the material on this page, you fully agree that you understand and consent to the above disclaimer.
 Women in TA Workshop
 IFTA 2026 conference in London, UK – SPECIAL PROMO
 S&P500 – Expected Green Path v. Red Path until the end of 2026